
 Online video advertising growth is rapidly accelerating this year, with U.S. advertisers expected to spend more than $7 billion on video for the first time ever.
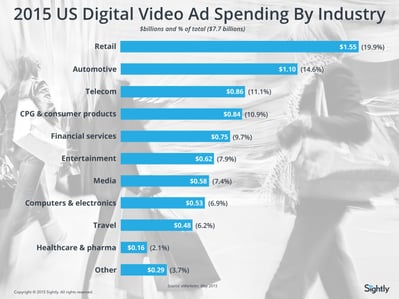
That's a 34% increase over 2014. (See infographic for spend breakdown by industry.)
In the first half of 2015, we saw many advertisers shift from one of these categories to another....
- Category #1 - All In
These advertisers realize the full benefits premium video inventory like YouTube's TrueView offers—and how it's different from other media, especially TV. They're embracing the concept of paying for completed views vs. impressions and demanding 100% viewability. - Category #2 - Make it like TV
These advertisers understand the value of reaching their audiences on all screens but they continue to buy video advertising like they've always bought TV advertising, even though the media are measured very differently. - Category #3 - Still Evaluating
These advertisers are aware of what's happening but aren't sure how to dive in. They may not have enough information or are waiting for agencies or third party recommendations on how to move forward with video advertising.
Which category best describes your business?
Take less than 30 seconds to complete this one-question poll and get a free, sharable version of the infographic, "2015 US Digital Video Ad Spending By Industry," as seen above.
Just select this button to get the infographic: